
📊 Full opportunity report: Bitcoin Battles Unfold in Live Warzone Visualization on ThorstenMeyerAI.com — validation score, market gap, and execution plan.

Get hardware and tech essentials delivered free with Prime
- Fast, free delivery on millions of items
- Prime Video, Amazon Music and more included
- Member-only deals all year
TL;DR
A new project visualizes Bitcoin trading as a live warzone, using real-time data from Binance and Coinbase. It offers an immersive, artistic display of market activity, not trading advice.
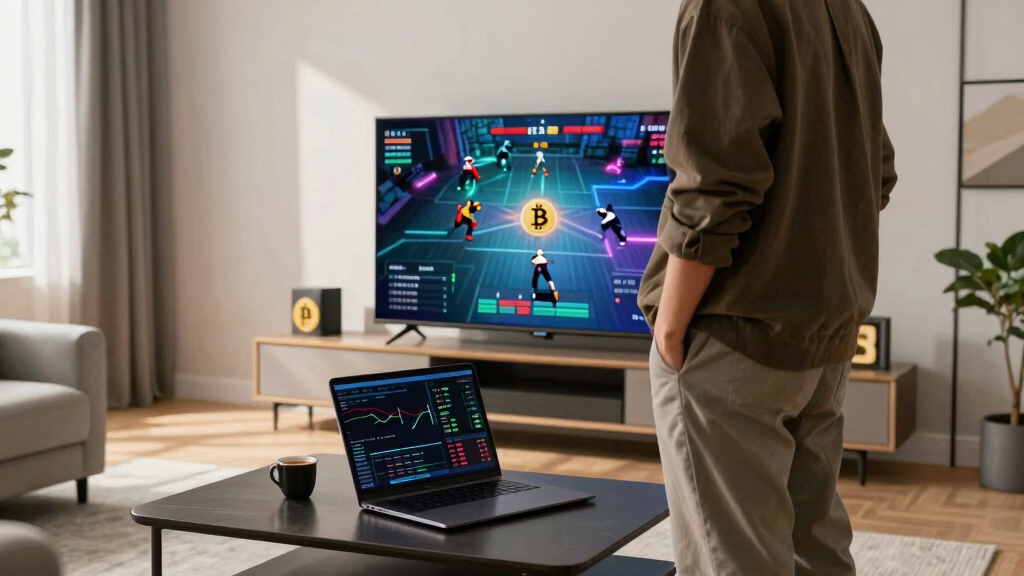
isbitcoindead.com has introduced a real-time, cinematic visualization of Bitcoin trading activity, depicting the ongoing market battle as a warzone. The project connects directly to live data streams from Binance and Coinbase, transforming every trade into visual combat, with no trading advice involved. This innovative display offers viewers an immersive view of market dynamics, emphasizing the chaos and tension inherent in Bitcoin trading.
The visualization, titled Bitcoin War, uses cutting-edge browser technology to create a dynamic battlefield scene where buy and sell orders visually clash, represented as combatants on a digital front line. Large liquidations are depicted as airstrikes, and a live DEFCON meter indicates market volatility. The entire system runs client-side, utilizing Canvas 2D graphics, WebAudio, and WebSocket streams, with a minimal footprint of approximately 180KB.
It automatically switches data sources between Binance and Coinbase if needed, ensuring continuous visualization. The project is purely artistic and educational, with a footer explicitly stating, “a live reading of the BTC/USDT tape · no advice, only war.” The visualization includes features like a moving camera, a war log, and a soundtrack generated within the browser, creating a visceral experience of market activity.
Implications of Visualizing Bitcoin Trading as a Warzone
This project highlights how advanced web technologies can be used for creative data visualization, offering a new way to interpret market activity beyond traditional charts. It underscores the chaotic nature of Bitcoin trading, providing an artistic perspective that may appeal to both enthusiasts and educators. While not a trading tool, it demonstrates the raw intensity of market movements and volatility, potentially influencing how traders and observers perceive market dynamics.
Bitcoin trading visualization software
As an affiliate, we earn on qualifying purchases.
As an affiliate, we earn on qualifying purchases.
Background and Development of Bitcoin War Visualization
The visualization was developed by isbitcoindead.com as an artistic project to depict Bitcoin trading activity in a novel, cinematic format. It leverages real-time data streams from Binance and Coinbase via WebSocket, ensuring live updates. The concept is rooted in the idea of transforming raw market data into a visceral, cinematic experience, emphasizing the chaos and competition inherent in trading markets. The project has gained attention for its innovative use of browser technology and its ability to run entirely client-side without backend infrastructure.
“This visualization offers a visceral, artistic perspective on market chaos, showing the relentless tug-of-war between buyers and sellers.”
— an anonymous researcher
cryptocurrency market data display
As an affiliate, we earn on qualifying purchases.
As an affiliate, we earn on qualifying purchases.
Unconfirmed Aspects of the Visualization’s Future
It is not yet clear whether the project will expand to include additional assets, features, or interactive elements. The long-term plans for further development or integration with trading platforms remain undisclosed. Additionally, the impact of this visualization on public understanding of market dynamics is still to be evaluated, and its influence on trading behaviors is unknown.
As an affiliate, we earn on qualifying purchases.
Next Steps for the Bitcoin War Visualization Project
Developers may continue refining the visualization, potentially adding new features like more detailed analytics or expanded asset coverage. There may also be efforts to promote the project among educational or artistic communities. Observers should watch for updates or new versions that could enhance interactivity or realism, as well as potential integration with other data sources or platforms.
As an affiliate, we earn on qualifying purchases.
Key Questions
Is this visualization a trading tool or advice platform?
No, the project is purely artistic and educational. It provides a visual representation of market activity without offering trading signals or advice.
How does the visualization work technically?
It connects directly to live data streams from Binance and Coinbase using WebSocket technology, rendering the data in real-time with Canvas 2D graphics and WebAudio within a browser.
Can I access the visualization easily?
Yes, it is available for free and runs instantly in any modern browser at war.isbitcoindead.com.
Will this project influence trading decisions?
No, it is designed as an artistic visualization, not a trading tool or advice platform. Users should not interpret it as guidance for trading.
Are there plans to expand this project?
The developers have not announced specific future plans, but further development and feature additions are possible.
Source: ThorstenMeyerAI.com
Columbus Day / Indigenous Peoples' Day Picks
long weekend sales
As an affiliate, we earn on qualifying purchases.