
To understand cryptocurrency price charts, start by identifying the chart type—candlestick, line, or bar—and learn what each indicates about market sentiment. Candlesticks show bullish or bearish momentum with different colors, helping you spot patterns that signal trend reversals or continuations. Use technical indicators like moving averages and volume to confirm trends, and watch support and resistance levels for breakout signals. Keep practicing, and as you explore, you’ll gain confidence in analyzing market behaviors.
Key Takeaways
- Identify the chart type (candlestick, line, or bar) to interpret price movements and market sentiment.
- Learn to read candlestick patterns and colors to assess bullish or bearish market trends.
- Use moving averages and volume indicators to confirm trend direction and strength.
- Recognize support and resistance levels to anticipate reversals or breakouts.
- Combine multiple chart elements and indicators for a comprehensive understanding of price action.
If you’re new to cryptocurrency trading, learning how to read price charts is essential for making informed decisions. These charts are your window into the market’s behavior, revealing valuable insights about current market trends, potential reversals, and entry or exit points. By understanding what the charts display, you can avoid impulsive trades and develop strategies based on solid data rather than guesswork.
Understanding how to read price charts is crucial for making informed crypto trading decisions.
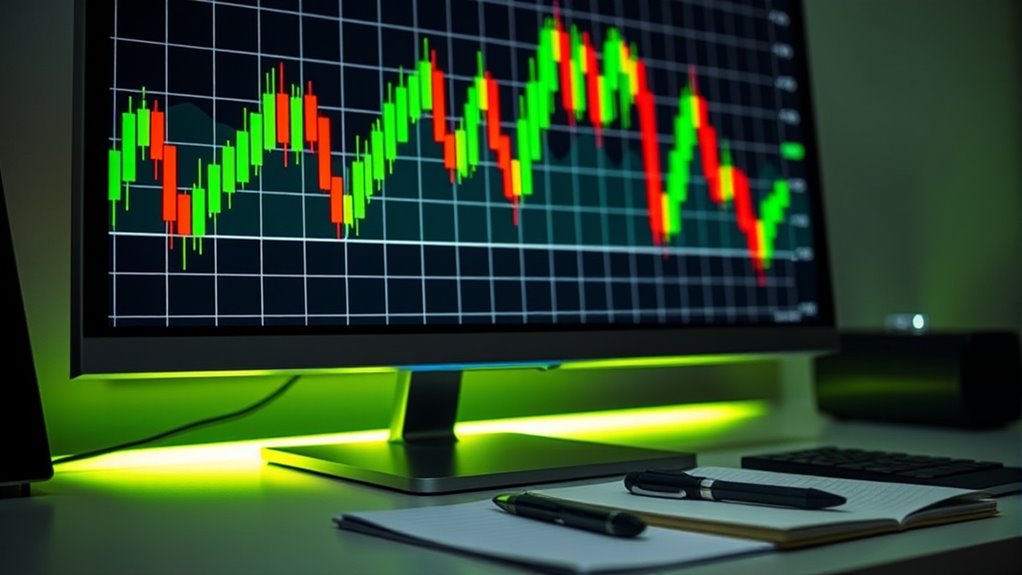
A good starting point is to familiarize yourself with basic chart types, such as candlestick, line, and bar charts. Candlestick charts are particularly popular because they show four vital pieces of information: the opening price, closing price, high, and low within a specific period. Each ‘candlestick’ provides a snapshot of market sentiment, with green or white candles indicating bullish movement, while red or black candles suggest bearish trends. Recognizing these patterns helps you determine whether the market is trending upward, downward, or moving sideways.
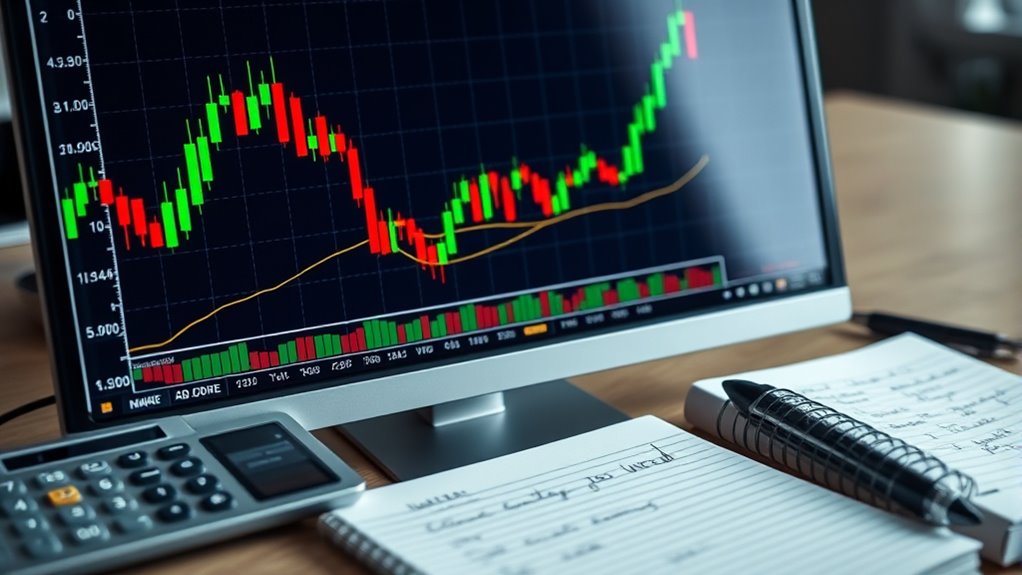
Next, focus on technical indicators, which are tools that analyze price data to forecast future movements. Moving averages, like the simple moving average (SMA) and exponential moving average (EMA), help you identify the direction of market trends. When the price crosses above a moving average, it often signals a bullish trend, whereas crossing below suggests a bearish phase. Volume indicators tell you how much trading activity is happening, confirming the strength of a trend—high volume during an upward move reinforces confidence in the trend’s sustainability, while declining volume might warn of a reversal.
Support and resistance levels are also fundamental concepts. Support is where the price tends to find a ‘floor,’ preventing it from falling further, while resistance acts as a ‘ceiling,’ limiting upward movement. Spotting these levels allows you to anticipate potential price reversals or breakouts, which are key moments for entering or exiting trades.
It’s important to combine these elements—market trends, candlestick patterns, technical indicators—to build a thorough view of the market. Don’t rely on a single indicator; instead, look for confirmations across multiple signals. As you practice reading charts, you’ll start noticing recurring patterns that can signal opportunities or warn you of risks. Remember, no chart or indicator guarantees future performance, but understanding how to interpret them will give you a significant edge in your cryptocurrency trading journey.

ELLIPAL X Card – Air Gapped Crypto Cold Wallet with Starter Accessory Kit,Secure Offline Storage for Bitcoin, Ethereum,NFTs & 10,000+ tokens
ELLIPAL X-Card:The ELLIPAL X-Card is a cold wallet utilizing air-gapped technology to generate your seed phrase. Featuring a...
As an affiliate, we earn on qualifying purchases.
Frequently Asked Questions
What Are the Best Tools to Analyze Crypto Charts?
You should use tools like TradingView or Coinigy to analyze crypto charts effectively. These platforms offer a variety of technical indicators, such as RSI, MACD, and Bollinger Bands, to help you identify trends. They also let you customize chart timeframes, from minutes to months, so you can analyze short-term movements or long-term patterns. These tools give you the insights needed to make informed trading decisions.
How Do I Interpret Volume Indicators?
Ever wondered what volume indicators reveal? They show how much trading activity is happening, helping you gauge market strength or weakness. When you see high volume during an uptrend, it signals strong buying interest, boosting your confidence in trading decisions. Always consider trading psychology and risk management alongside volume signals; they help you stay disciplined and avoid emotional trades, ensuring you’re making informed, balanced moves in the crypto market.
Can I Predict Future Prices Using Charts?
You can’t predict future prices with certainty using charts, but technical analysis helps you identify potential trends. By studying patterns and market psychology reflected in price movements, you can make educated guesses about where prices might go. Keep in mind, charts aren’t foolproof, so combine technical analysis with other factors to improve your predictions and manage risks effectively.
What Are Common Chart Patterns I Should Recognize?
You should recognize common chart patterns like head and shoulders, double tops and bottoms, and triangles, which indicate trend formations. Keep an eye on candlestick signals such as doji, hammer, and engulfing patterns, as they reveal potential reversals or continuations. By identifying these patterns early, you can better predict market movements and make informed trading decisions. Practice spotting these signals regularly to improve your chart-reading skills.
How Does News Impact Cryptocurrency Price Charts?
Did you know that 60% of crypto traders say news markedly influences their decisions? When news hits, it drastically shifts market sentiment, causing sharp price movements on charts. You should track news analysis closely because positive headlines can boost prices, while negative ones may cause drops. Understanding this impact helps you anticipate trends and make smarter trades, recognizing that news acts as a catalyst for sudden chart changes.
D'CENT Hardware Wallet – Biometric Cold Wallet for Crypto with Fingerprint Authentication | Secure Bluetooth Storage for Bitcoin, Ethereum, XRP, XDC, Solana, Stablecoins & More
EAL5+ CERTIFIED SECURE ELEMENT + FINGERPRINT PROTECTION — Your private keys stay encrypted offline on a certified EAL5+...
As an affiliate, we earn on qualifying purchases.
Conclusion
Now that you’ve learned to read cryptocurrency price charts, you hold the compass to navigate this digital ocean. Think of the charts as your map, guiding you through turbulent waters and calm currents alike. With each candle and trend line, you gain the wisdom to spot opportunities and avoid storms. Keep practicing, and soon you’ll sail confidently through the unpredictable waves of the crypto universe, turning uncertainty into your greatest adventure.

Trezor Safe 3 - Passphrase & Secure Element Protected Crypto Hardware Wallet - Buy, Store, Manage Digital Assets Simply and Safely (Solar Gold)
Unparalleled Security: Protect your assets NDA-free EAL 6+ Secure Element, offering robust defense and complete transparency
As an affiliate, we earn on qualifying purchases.

TANGEM Crypto Wallet Pack of 2 – Trusted Cold Storage Hardware Wallet for Bitcoin, Ethereum, NFTs & Altcoins – 100% Offline Crypto Cold Wallet
Proven security at scale: Over 9 years and millions of cards issued with no known remote hacks, while...
As an affiliate, we earn on qualifying purchases.